.gif)
How to Make Your Annual Reports Matter
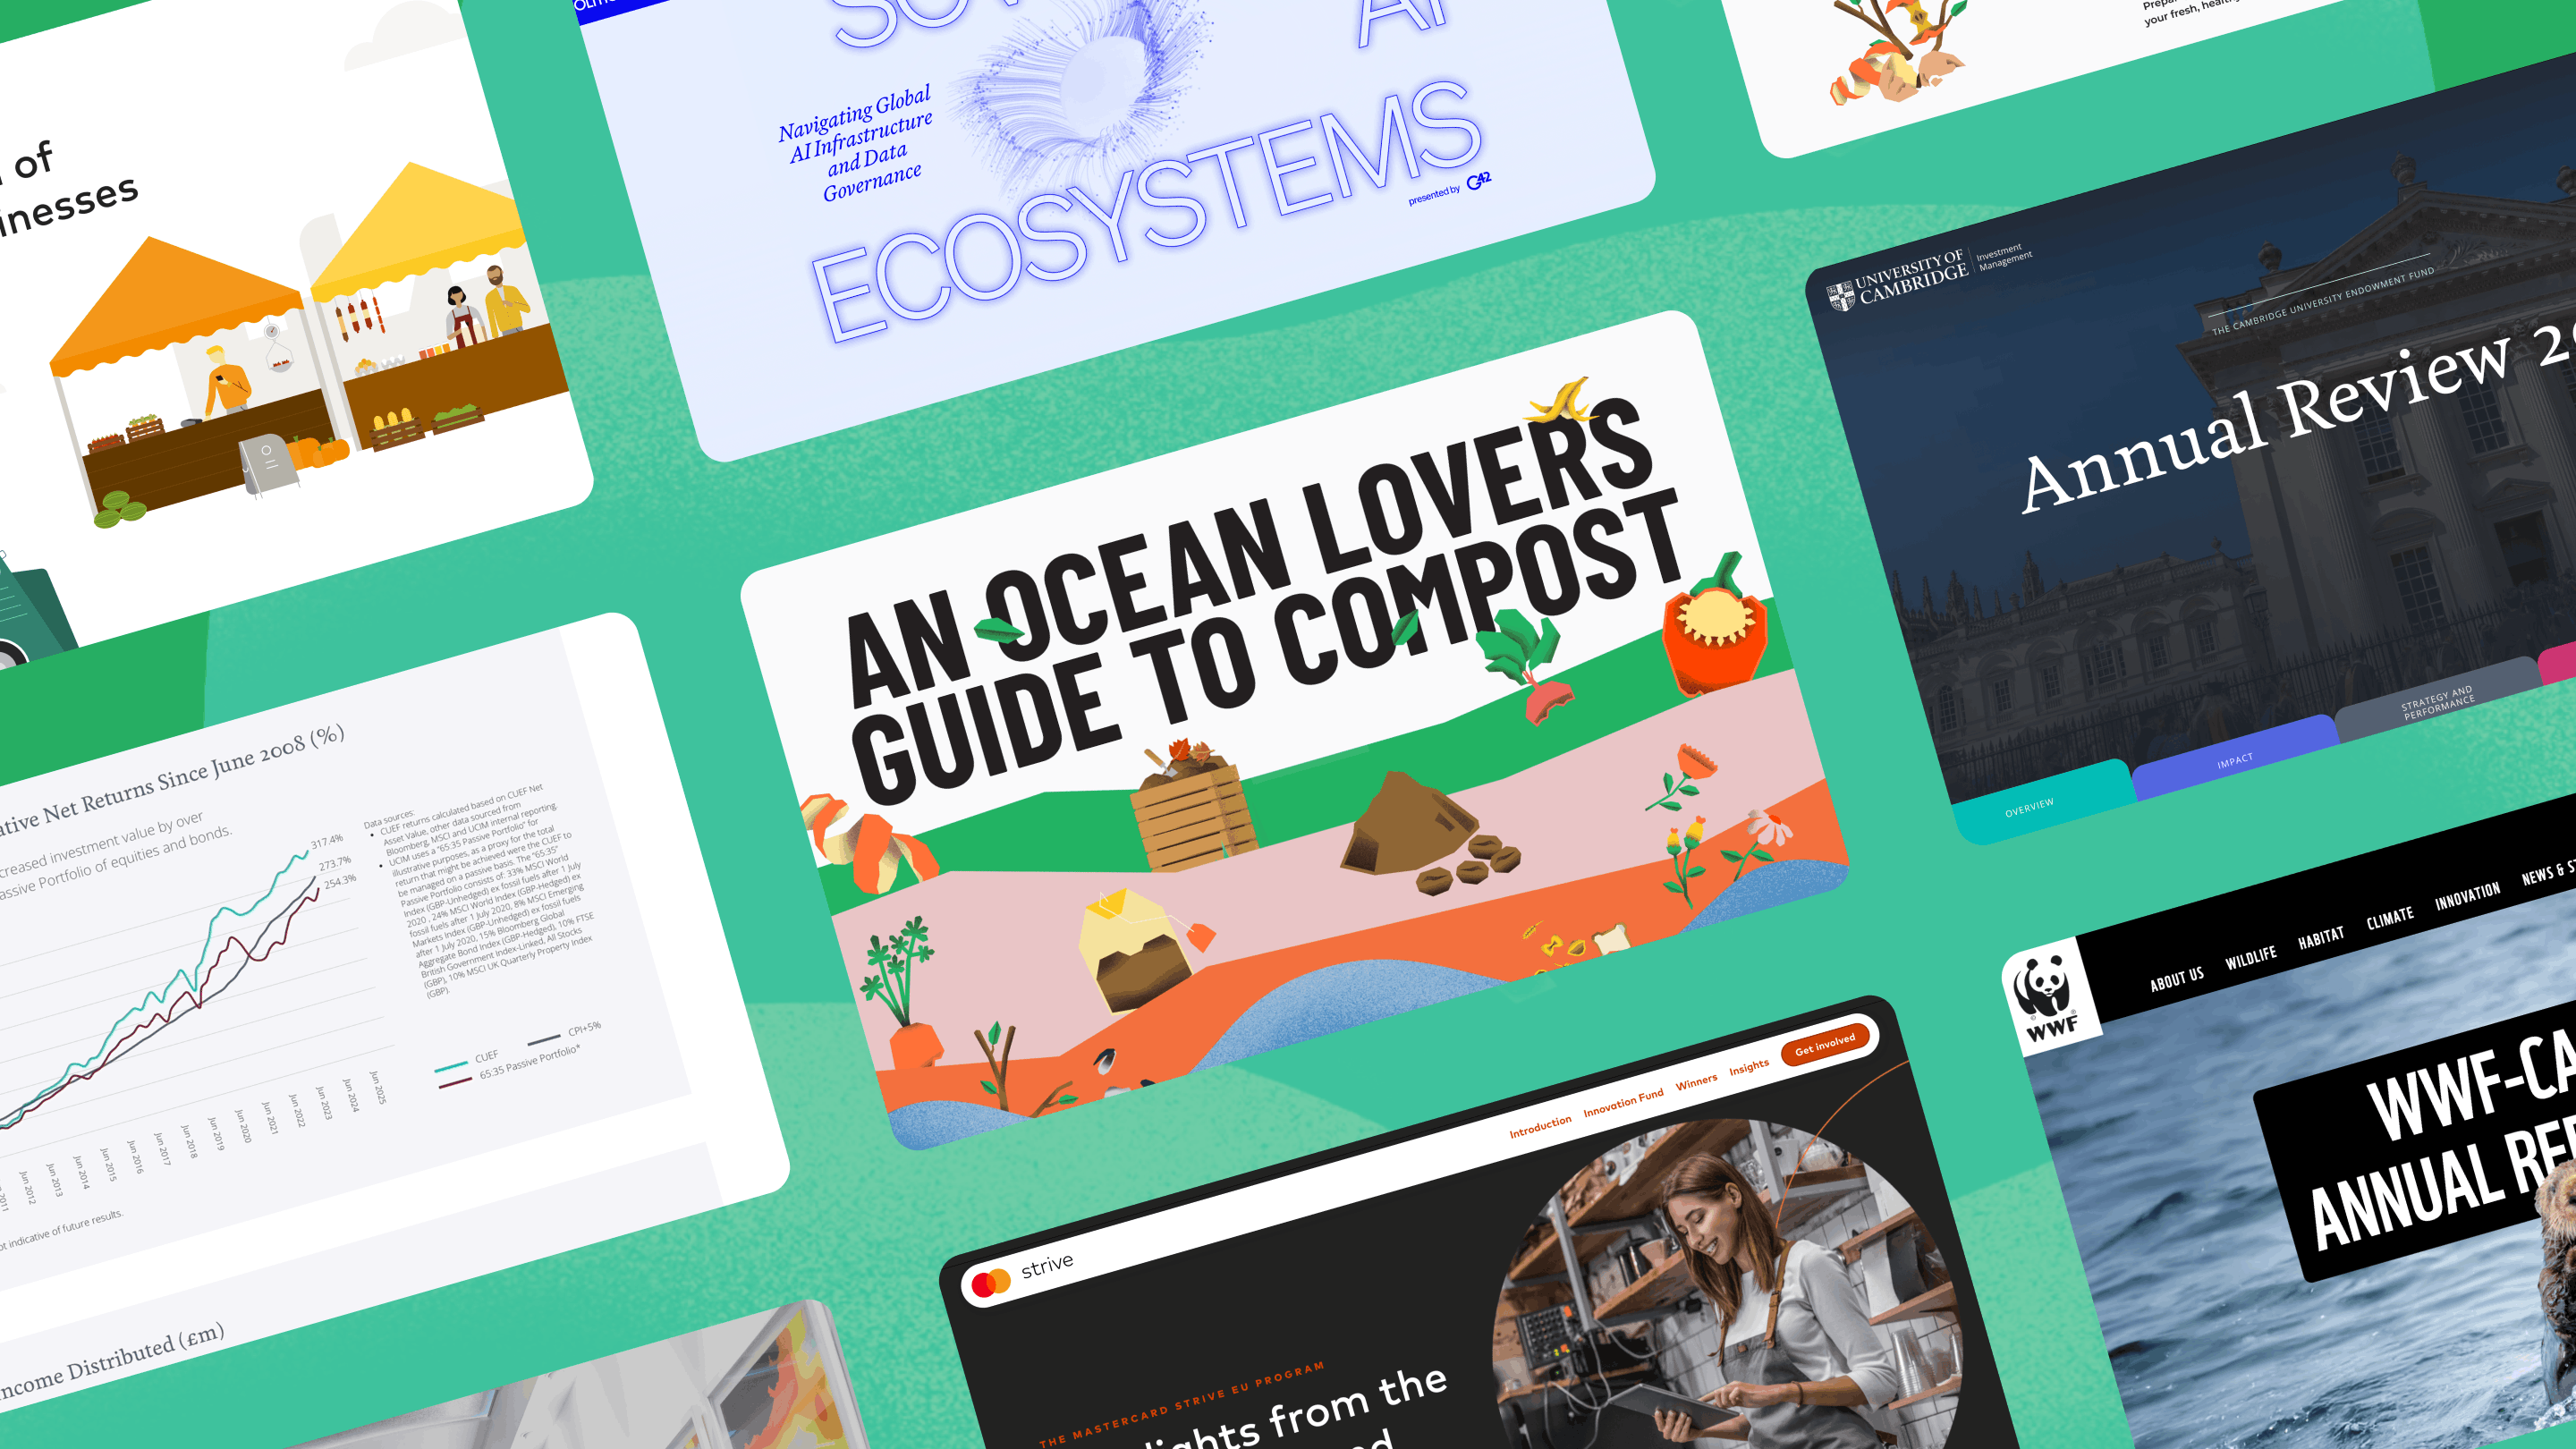
An annual report isn’t just a compliance document. It’s one of the biggest storytelling opportunities a brand has. It’s a chance to show impact, progress, and purpose in a way that actually connects with people.
.webp)
Stop Thinking Document. Start Thinking Story.
Traditional annual reports are built like archives: long PDFs, dense pages, and static charts.
But that’s not how people engage with information anymore. Today’s audiences scroll, explore, and interact. They expect content to feel intuitive, visual, and easy to navigate.
When you approach your annual report as a digital experience rather than a document, everything changes. Instead of presenting information section by section, start with a narrative:
- What changed this year?
- What impact did you make?
- What’s the bigger story behind the numbers?
No-code platforms like Webflow, Vev, Framer, and Ceros make it possible to turn that narrative into an interactive experience, faster and more cost-efficient than traditional development.
The shift is simple: from static PDF to guided digital journey.
.webp)
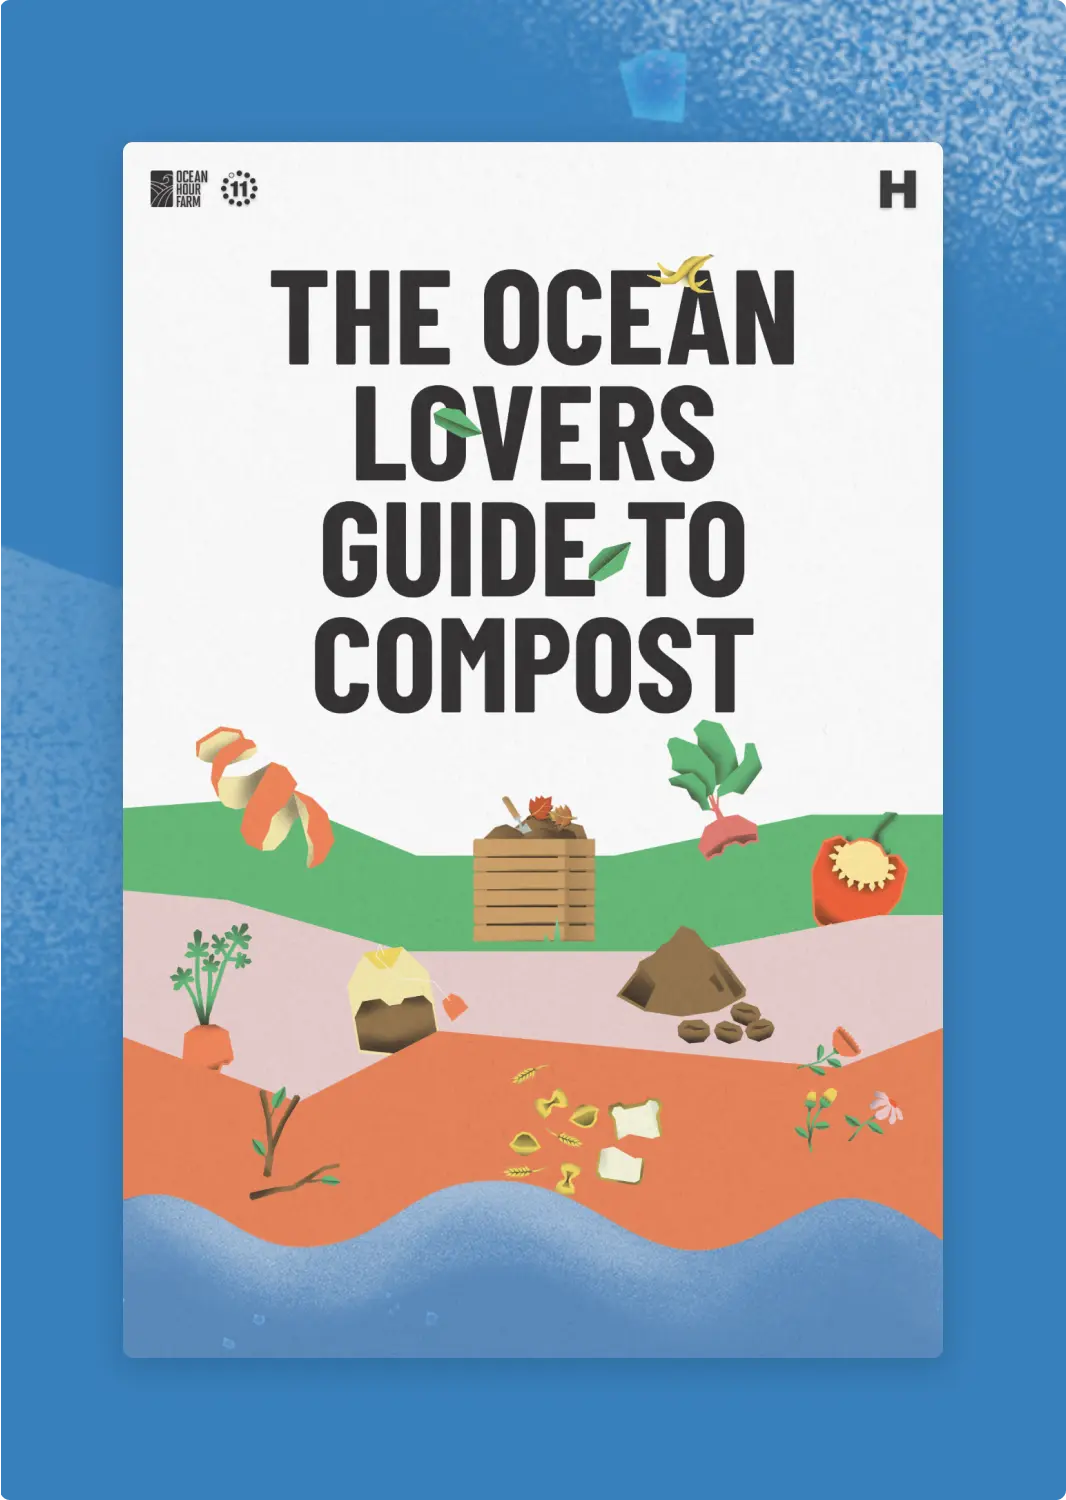
Bring your Numbers to Life
Annual reports are full of valuable insights. The problem is, they’re often hidden inside static tables that are difficult to scan and even harder to remember.
Interactive design helps audiences understand information faster and stay engaged. Animated charts can show change over time. Layered visualisation reveals complexity without overwhelming the reader. Backend-editable modules allow teams to update data easily year after year, while lightweight motion tools like Rive or Lottie add clarity without affecting performance.
Just as important is how the information is revealed. Techniques like scrollytelling, hover states, and expandable sections break complex content into manageable pieces, allowing readers to explore at their own pace.
And the value doesn’t stop once the report is live.
One of the biggest advantages of digital reporting is visibility. With tools like Google Analytics or Microsoft Clarity, you can see how people actually engage — where they scroll, what they interact with, and where they drop off. Your annual report becomes a learning tool that helps you improve the experience year after year.

.webp)
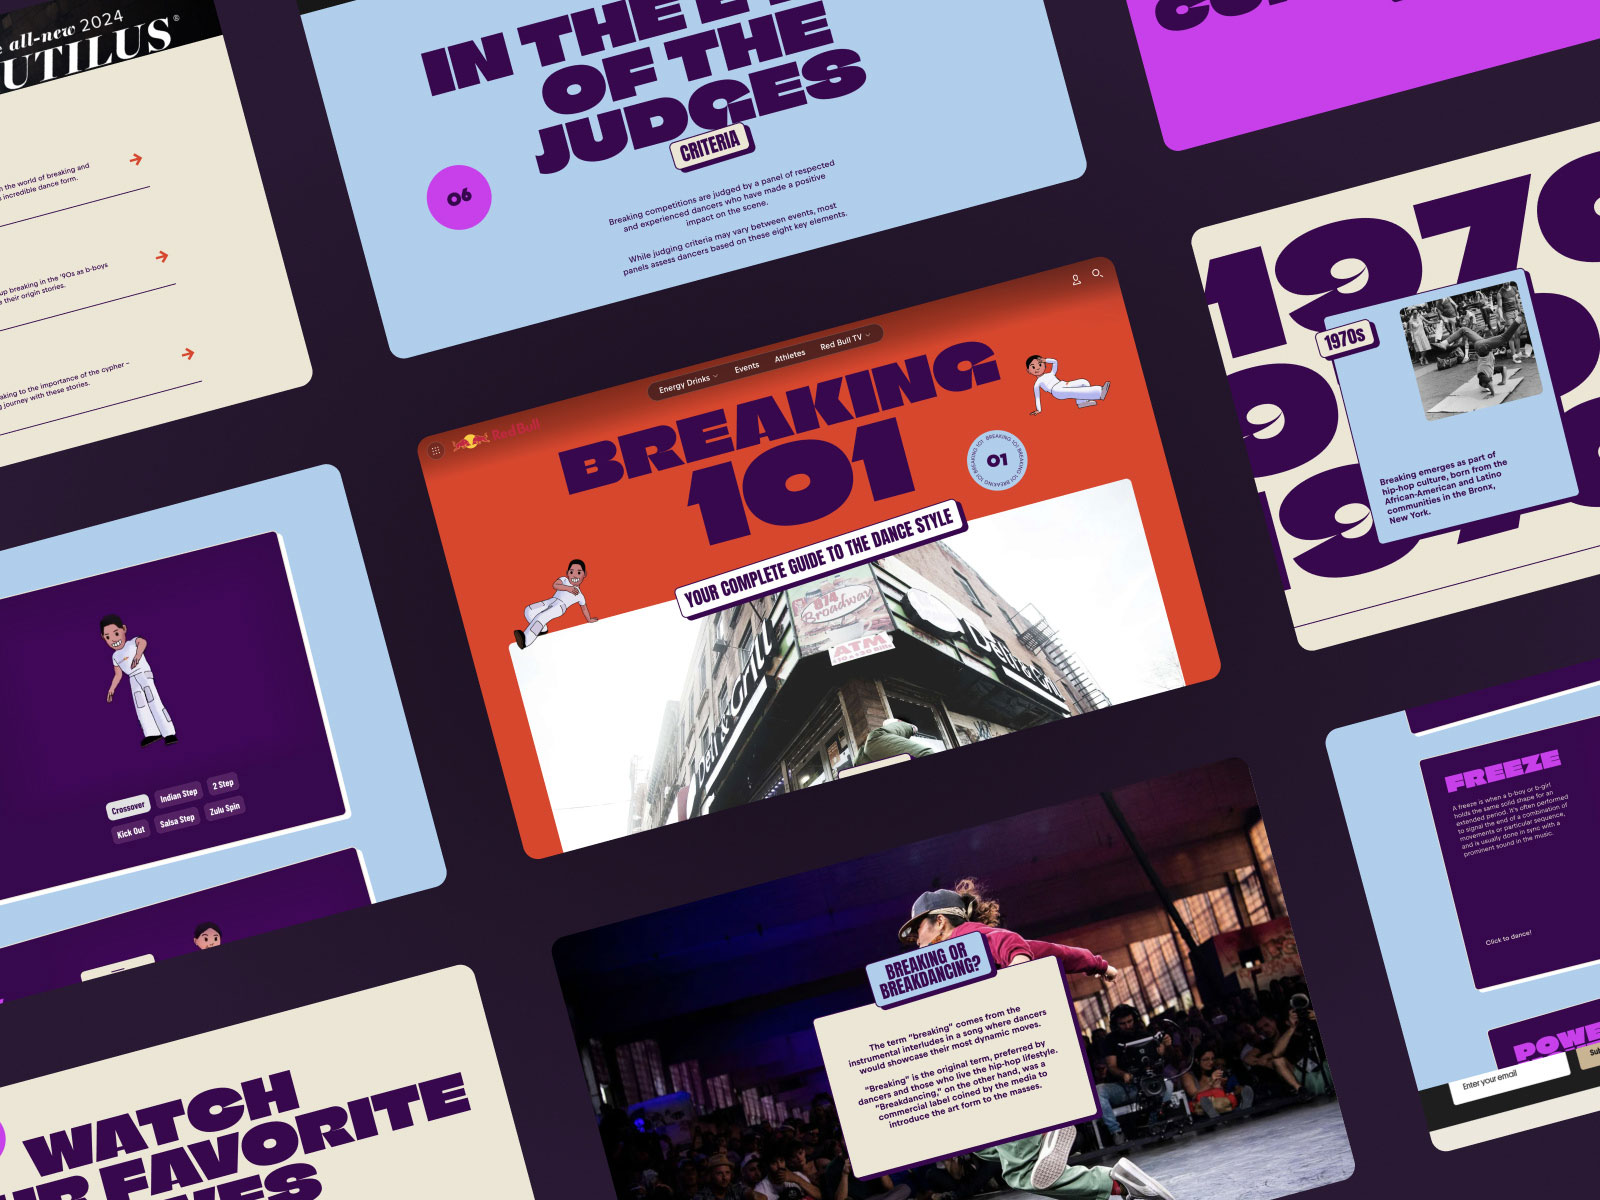
Design for How People Actually Read
People skim annual reports. They jump between sections. They look for the information that matters to them.
Designing for this behaviour means creating clear navigation, logical structure, and content that’s easy to scan. Sticky menus, side navigation, and anchored sections help users move quickly through the experience. Bite-sized content, supported by progressive reveal techniques, keeps the interface clean while still allowing for depth.
Accessibility and multilingual support are equally important, especially for global organisations. The goal isn’t to add more content, it’s to make the right content easier to find, understand, and remember.
What’s a Rich Text element?
The rich text element allows you to create and format headings, paragraphs, blockquotes, images, and video all in one place instead of having to add and format them individually. Just double-click and easily create content.
Static and dynamic content editing
A rich text element can be used with static or dynamic content. For static content, just drop it into any page and begin editing. For dynamic content, add a rich text field to any collection and then connect a rich text element to that field in the settings panel. Voila!
How to customize formatting for each rich text
Headings, paragraphs, blockquotes, figures, images, and figure captions can all be styled after a class is added to the rich text element using the "When inside of" nested selector system.
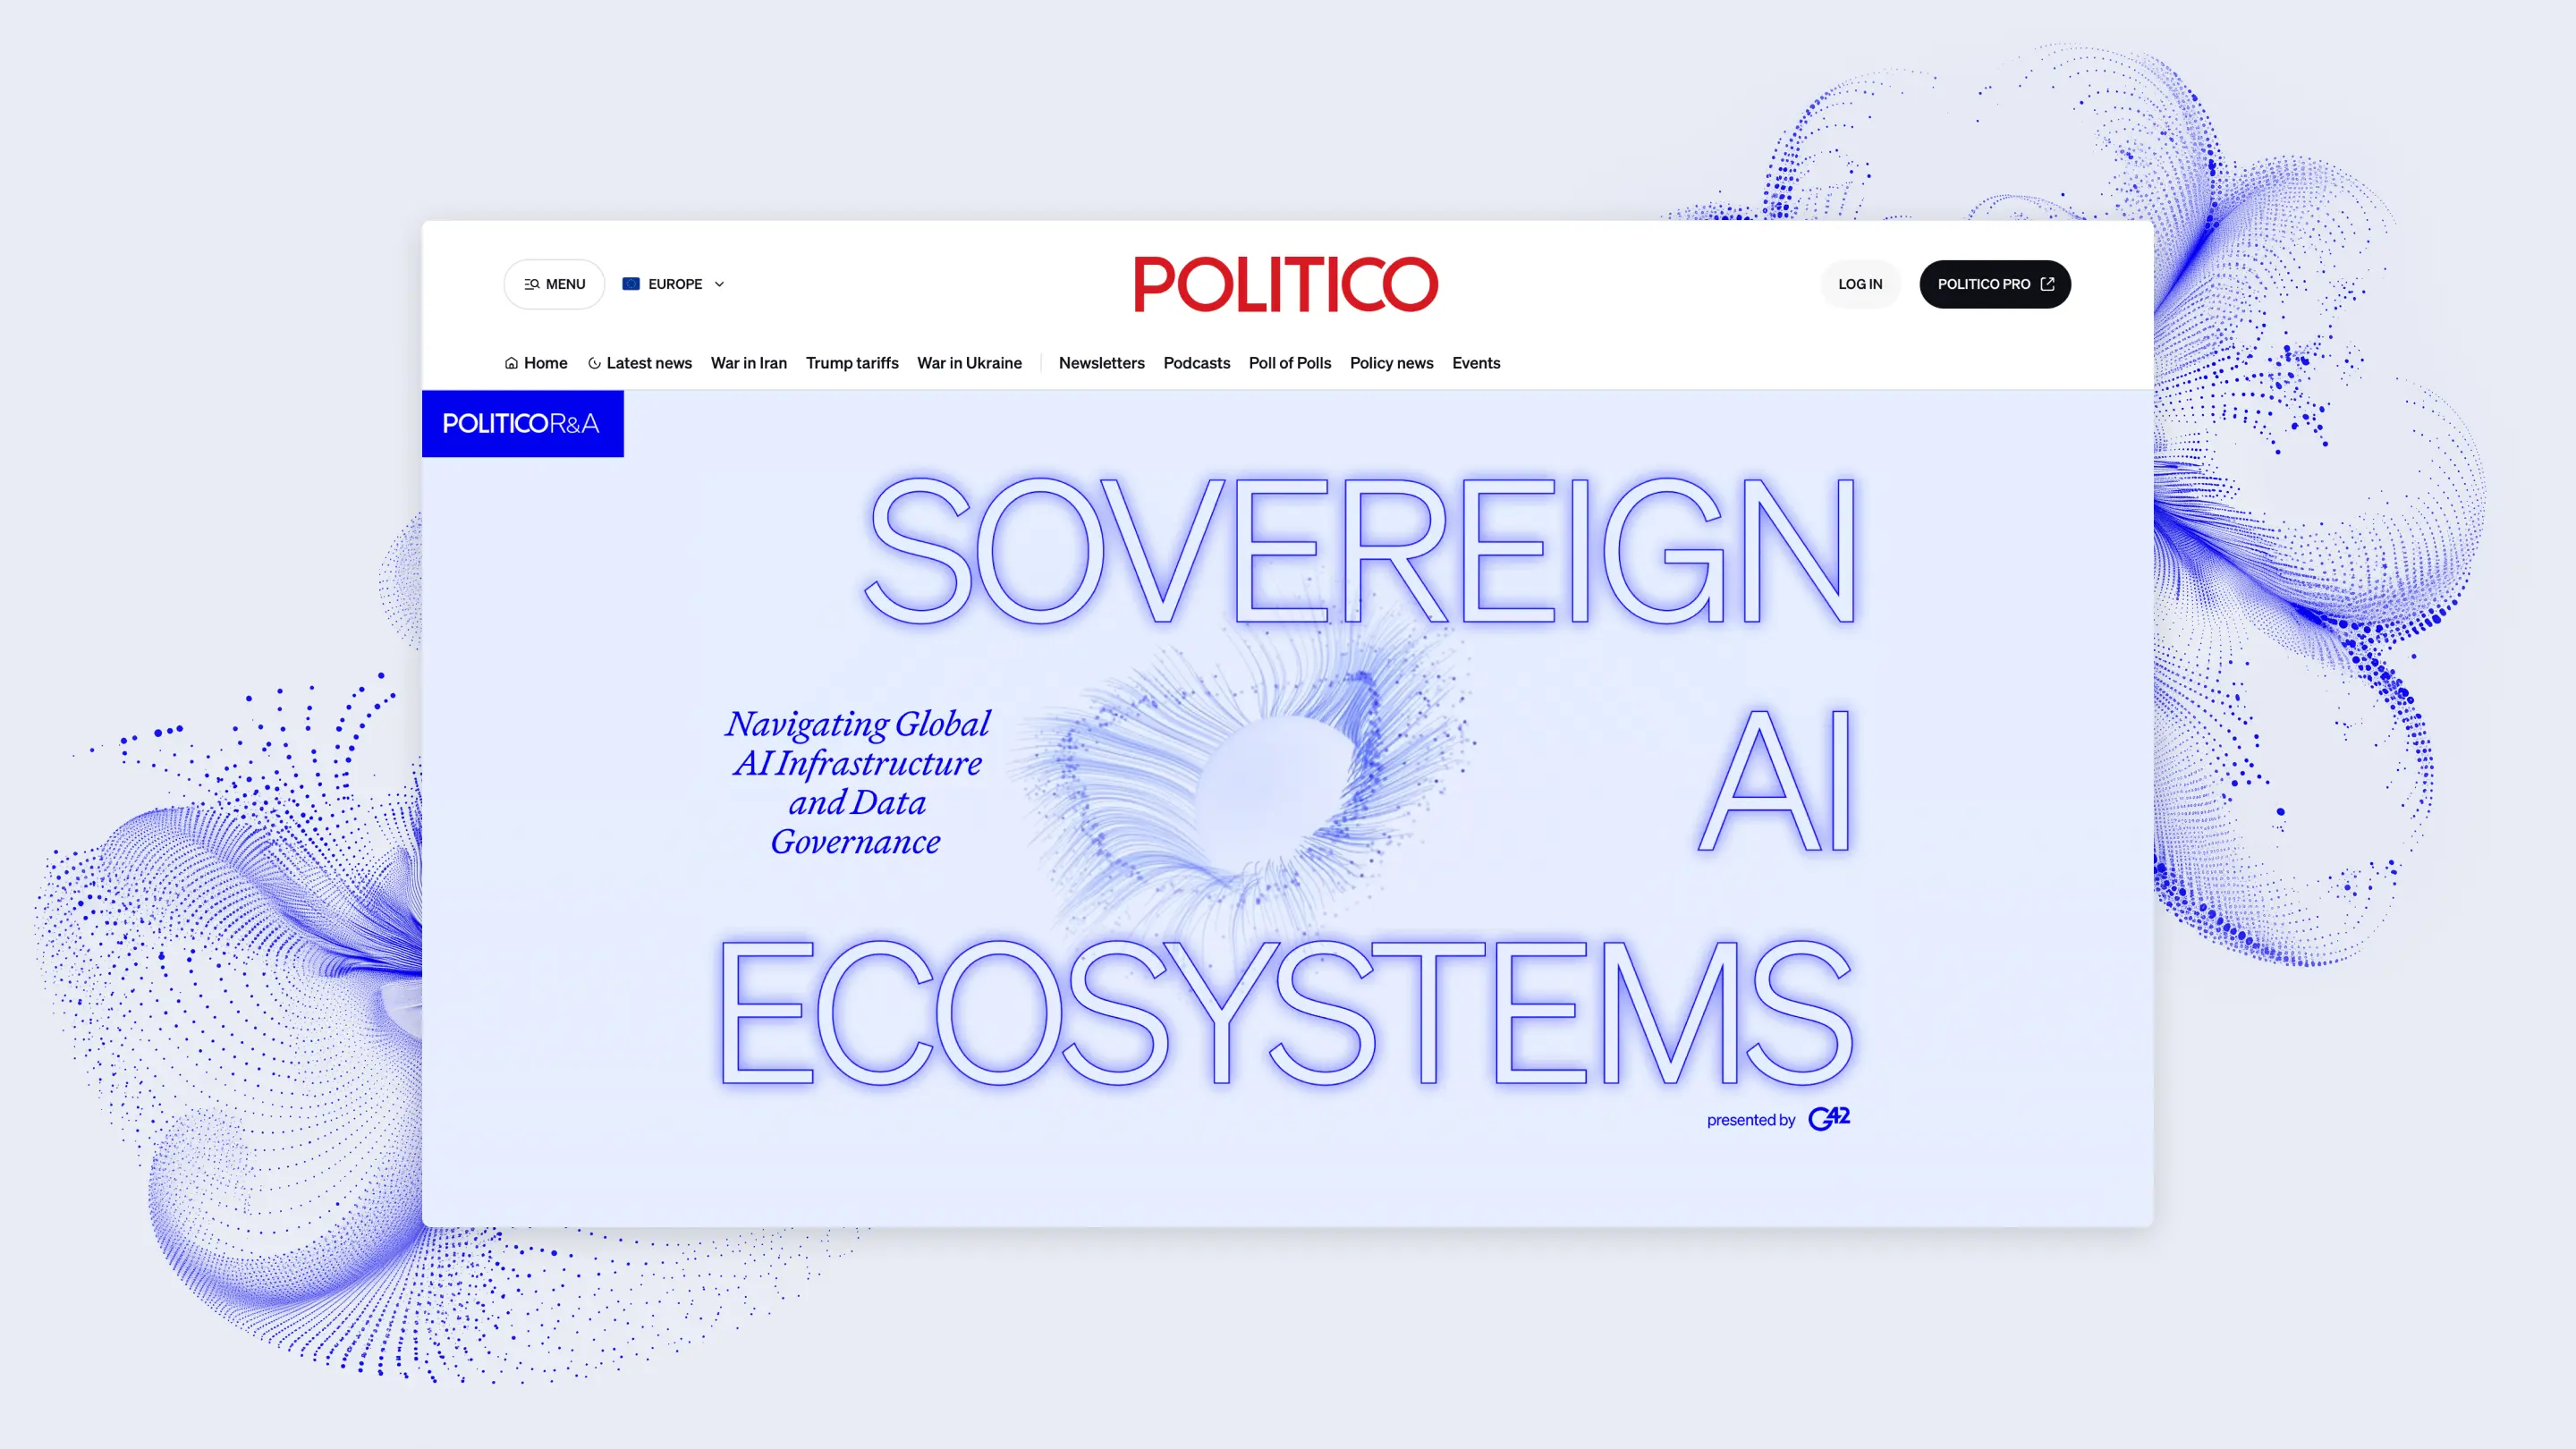
Turn It Into a Long-Term Brand Experience
This is where annual reporting becomes a real brand asset.
Instead of static pages, you can create an experience that feels alive:
- Motion-led hero sections or background video
- Custom illustration, animation, or AI-generated visuals
- Subtle interactions like parallax and transitions
- Optional PDF downloads for stakeholders who still need a traditional format
When built with modular, no-code systems, your report becomes scalable — easier to update, translate, and evolve. The most effective reporting strategies treat annual reports as a multi-year system, not a one-off project.
The benefits:
- Reusable modules and templates
- Faster production each year
- Lower long-term costs
- Consistent storytelling over time
At HLabs, we structure projects around modular packages (typically 6–12+ content modules) with fixed timelines — giving teams predictability, efficiency, and room to grow.
See how HLabs helped 65+ clients reimagine their reporting with 2,500+ interactive projects delivered in 16 languages for publishers, agencies, and global brands.

.webp)
We’ll show ours if you share yours.
Share your details so we can stay in touch and directly show you premium HLabs content!