.gif)
Your 2025 data, reimagined for engagement: 5x enterprise examples of interactive timelines
My first day back was chocka with profit reports, chasing timesheets and working out the new Xero dashboard UI, all tasks working with our data... to find what trackable strategies really worked.
Showcasing these milestones to your clients, investors and team can be made more engaging with interactive timelines.
Here's five, live examples showing you how to turn information, into attention. They give your audience a reason to scroll, click, compare, and stay with the story just a little longer.
Bauer Media Interactive Timeline (Made in collaboration with Plastic Pictures)
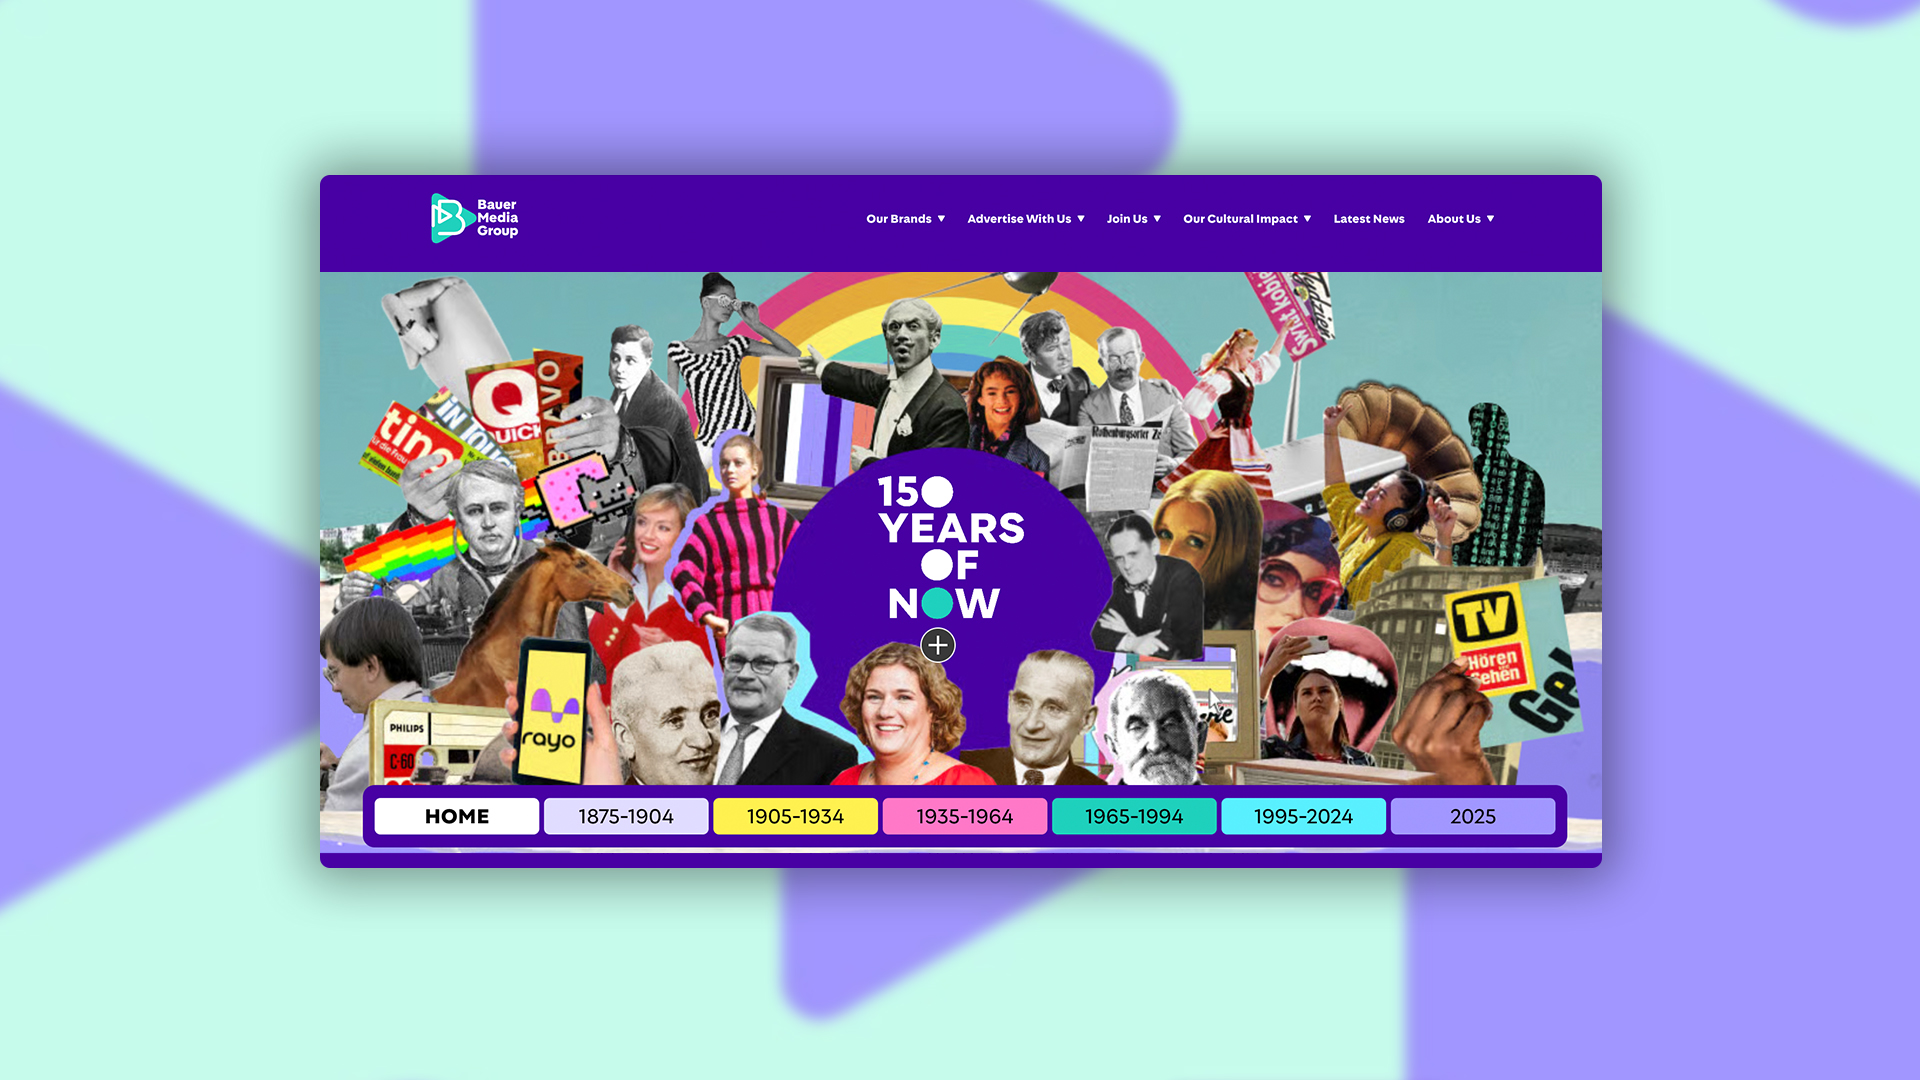
Bauer Media Group '150 years of now'
A big brand anniversary can easily become a long page of facts. This became a guided journey with tabs, hotspots and beautiful graphics created with our agency parter Plastic Pictures. Vev, the no code tool it was built on, gave us the flexibility to build a timeline module that feels editorial, with animation that keeps the reader clicking, all hosted on their public CMS page with phased launches throughout the year.
View Experience
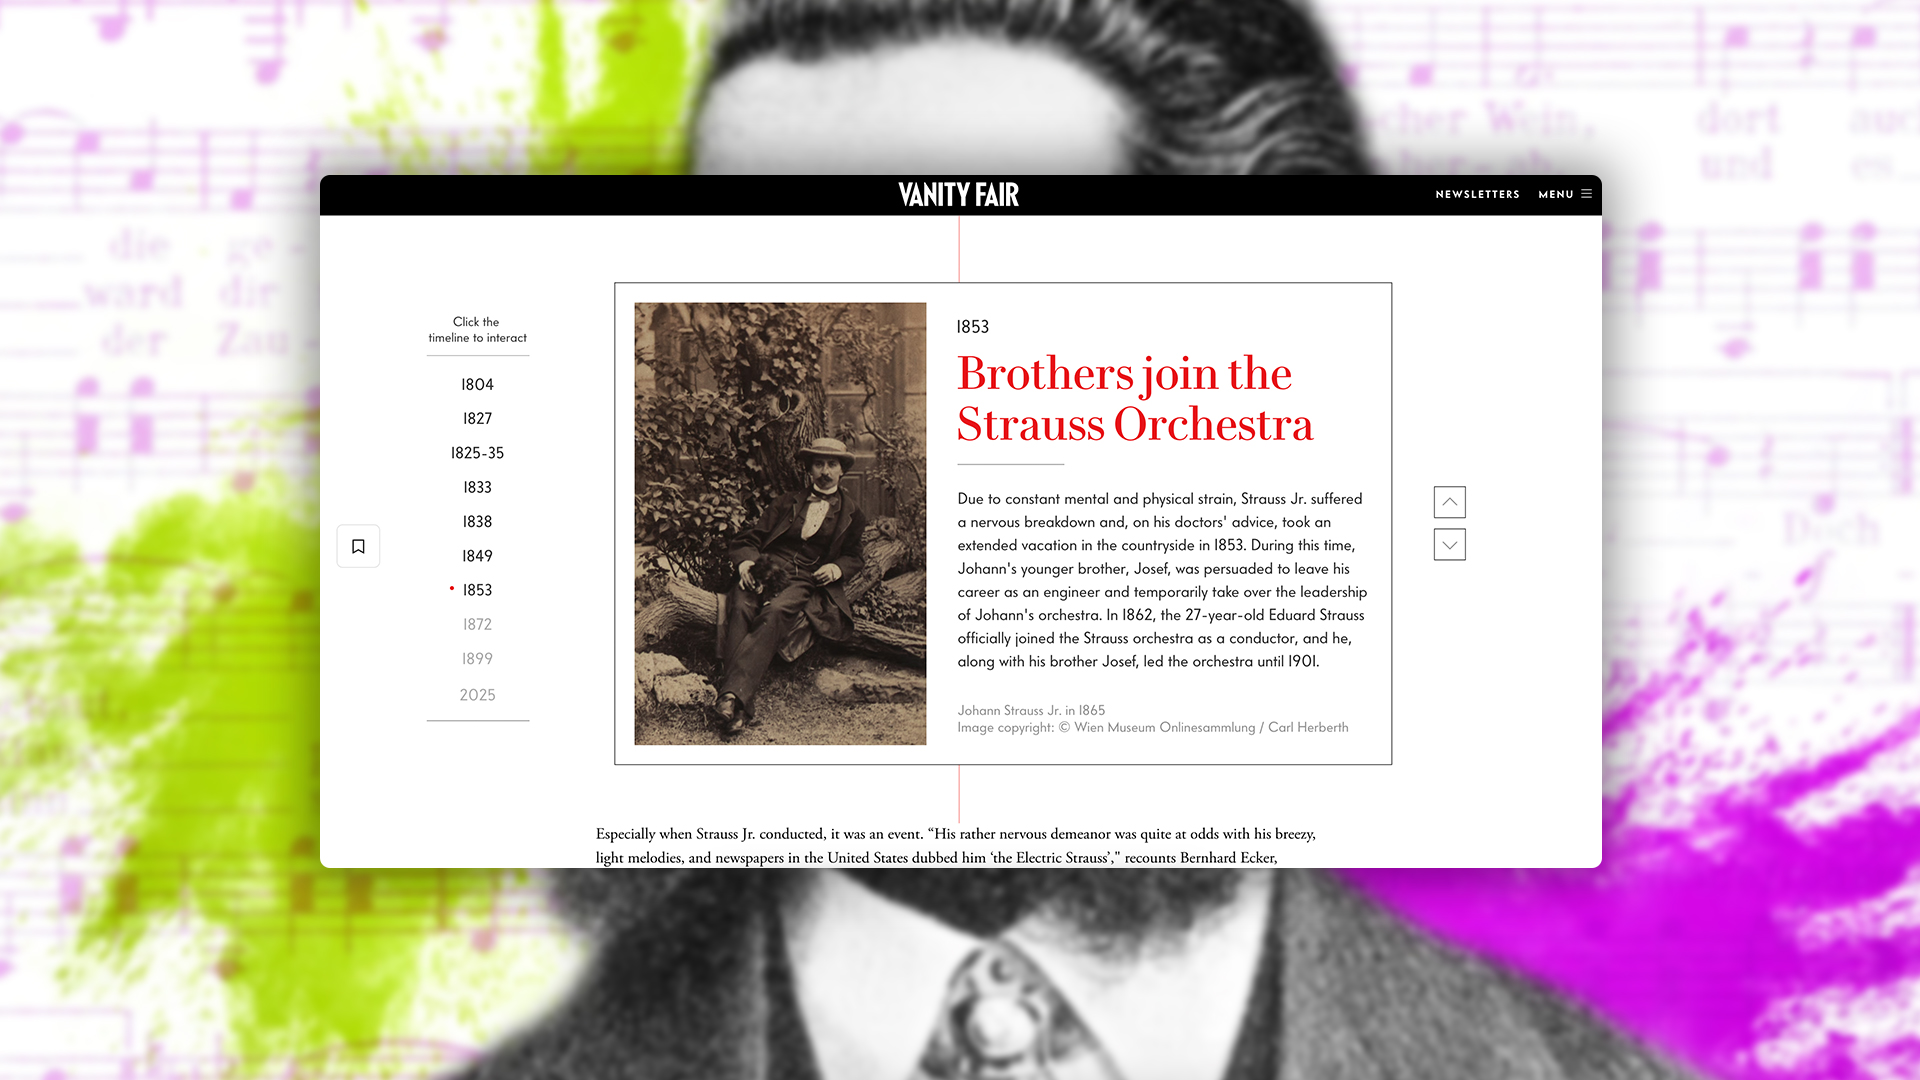
Vanity Fair's 'Straussmania'
Not every timeline needs to be the whole experience. Here, the timeline worked as a module, breaking up a longer article, moving through captions from 1804 to 2025 with fast loading images. Built in Ceros, it’s a strong example of how you can add bespoke functionality, without rebuilding your entire site. The animations are smooth and template from a huge branded content library, all created in just a few days!
View Experience
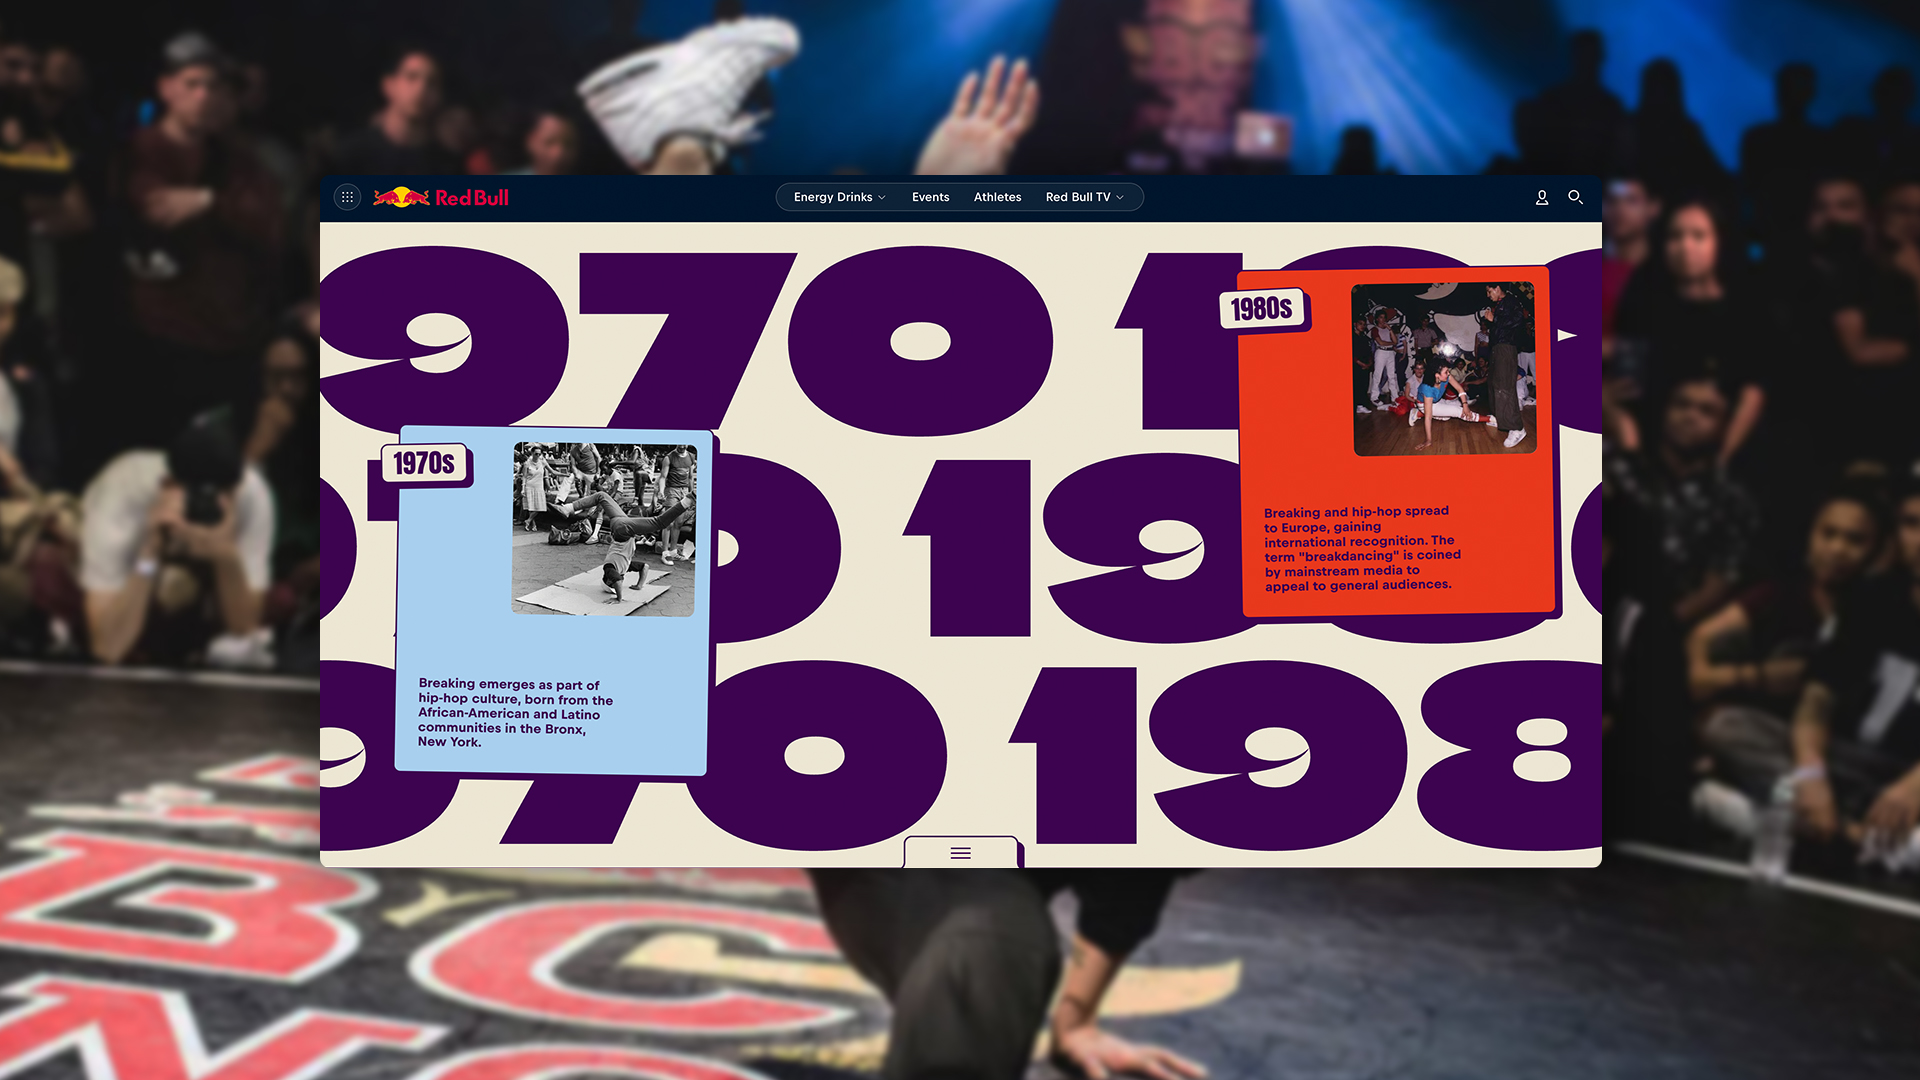
Red Bull 'Beginners guide to breaking'
This example used every graphic device & animation technique we could throw at it. This was a full takeover landing page, featured a horizontal scroll of the history that traced the origins of breaking to the Bronx. That was enhanced further by 3D, illustrated, animated models of 22 dance moves, all created using MoveAI video tech. It didn’t just tell the story, it performed it.
View Experience
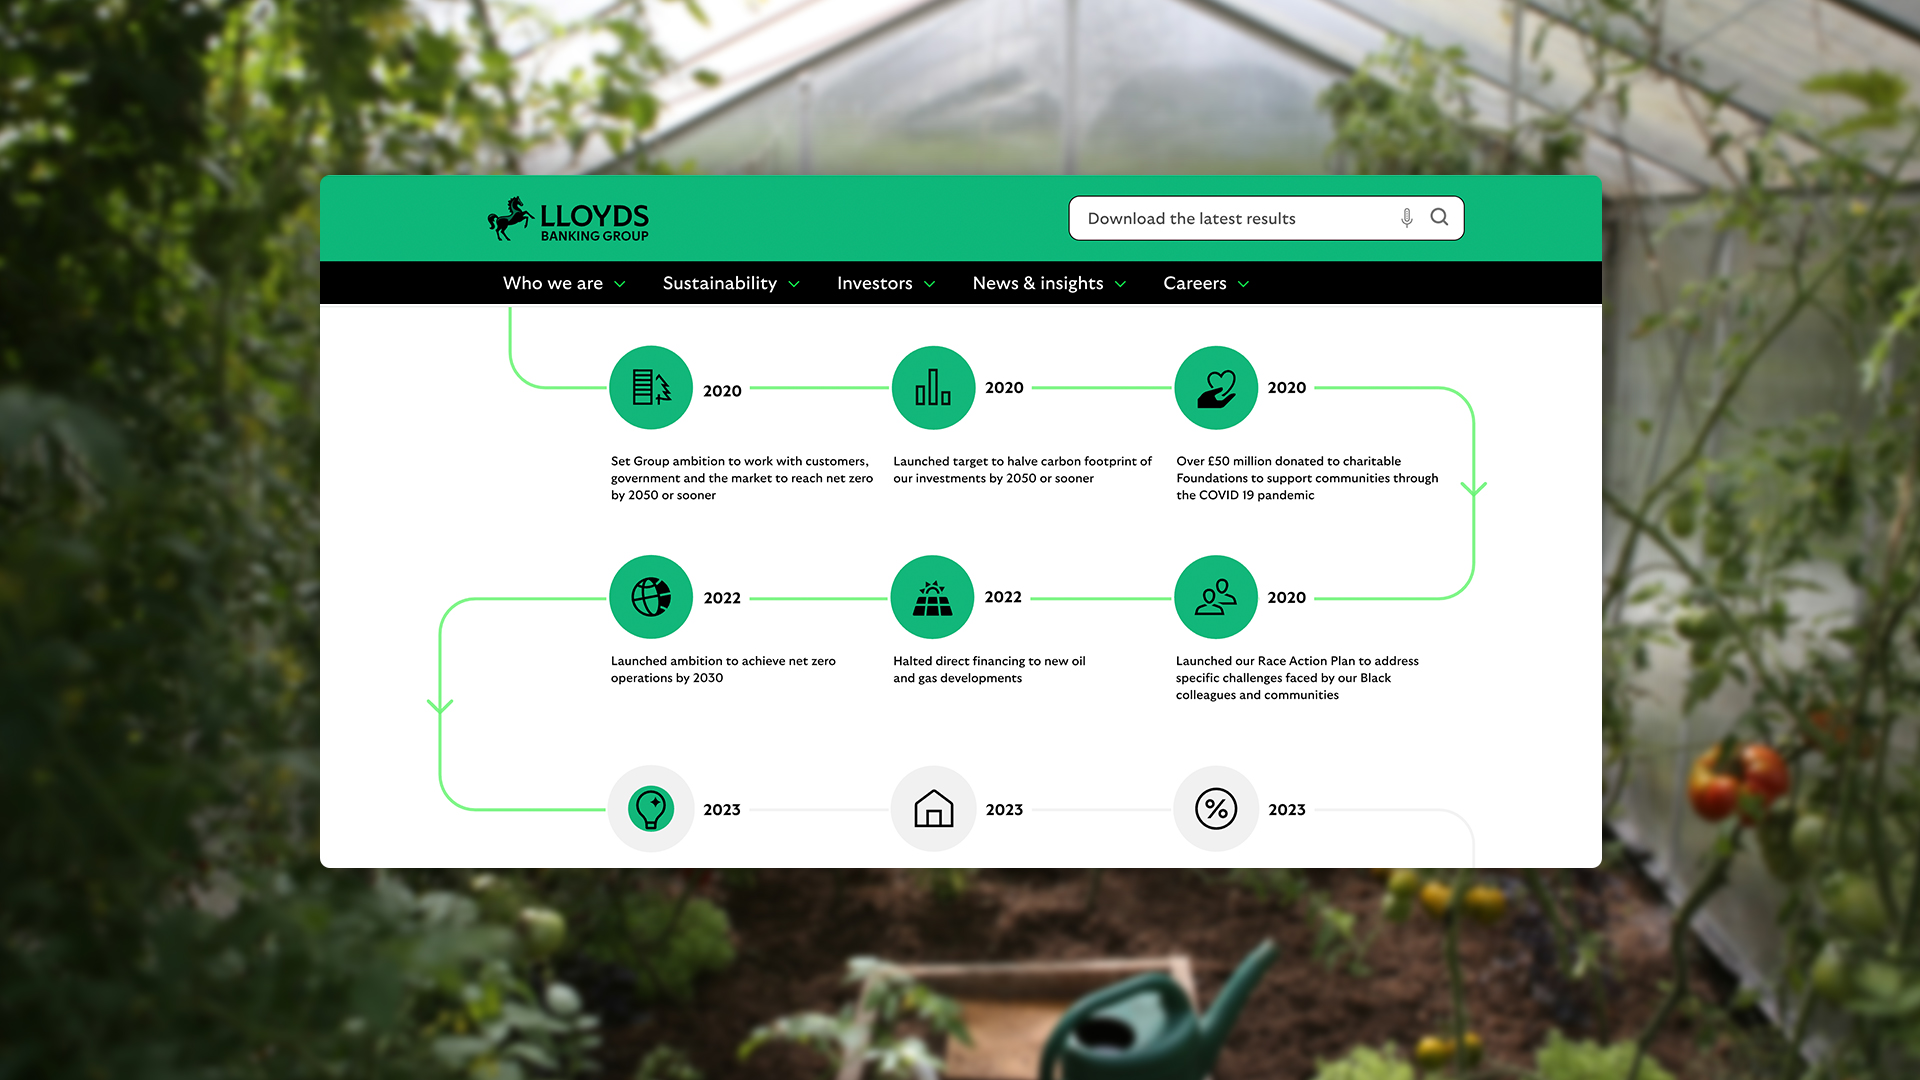

Lloyds Banking Group 'Sustainability Report'
Timelines can be lightweight, with no buttons and still be effective. For Lloyds, we used LottieFiles to create an animated vector milestone sequence for their annual report. Fast-loading, brand-consistent, and ideal for showing progress without adding scrolling lag is the easiest way to add motion to your CMS. This was in collaboration with our partner agency Emperor.
View Experience
What’s a Rich Text element?
The rich text element allows you to create and format headings, paragraphs, blockquotes, images, and video all in one place instead of having to add and format them individually. Just double-click and easily create content.
Static and dynamic content editing
A rich text element can be used with static or dynamic content. For static content, just drop it into any page and begin editing. For dynamic content, add a rich text field to any collection and then connect a rich text element to that field in the settings panel. Voila!
How to customize formatting for each rich text
Headings, paragraphs, blockquotes, figures, images, and figure captions can all be styled after a class is added to the rich text element using the "When inside of" nested selector system.
WWF-Canada 'Living report'
Static reports are usually where attention goes to die, unless you design for behaviour. For WWF we created a Webflow experience and used Rive for interactive components that highlighted key data points. From interactive graphs, animated carousels to flip cards and popups this report had to be digitised in it's entirety. With all this functionality, we had to consider accessibility too, from captions to fully translated sections for local Aboriginal communities.
View Experience
If your 2026 goal is higher engagement, a simple timeline could be a practical place to start: Give people a path through the content. Reward their scroll. Make the story measurable.
#InteractiveStorytelling #DigitalPublishing #WebDesign #NoCode #Webflow #Rive #Ceros #Vev #LottieFiles #BrandStorytelling #ContentStrategy
#CreatingStoriesThatMatter
If you’re planning a campaign, report, anniversary, or also have 'too much friggin data' this quarter, I’m happy to share what we can do to share it with your audience!
We’ll show ours if you share yours.
Share your details so we can stay in touch and directly show you premium HLabs content!